Post 1
States are the building blocks
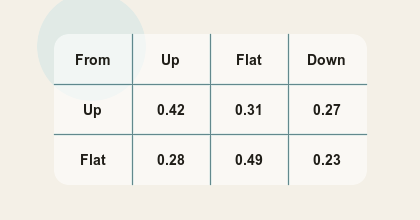
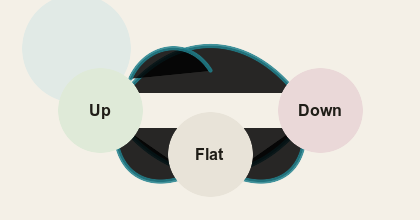
A Markov chain starts by converting a messy sequence into a small set of states. In this site, every trading day becomes up, flat, or down based on the day’s price change.
That simplification makes the model readable. Instead of asking where price will go exactly, we ask how often the market moved from one state to another in the recent past.